
Description
4Bulls is an ecosystem based on the DAO concept (decentralized autonomous organization). The system is powered by the 4Bulls token (ticker symbol 4B). Participants in the DAO receive distributions from all fees collected from NFT stakers, liquidity providers, and referrers.
4Bulls’ Crypto Price Prediction tool was developed to provide crypto investors with a type of triage system for weeding out high-risk/low-reward coins and tokens and steering users toward the lower-risk/higher-reward assets.
How the 4Bulls Price Prediction Tool works
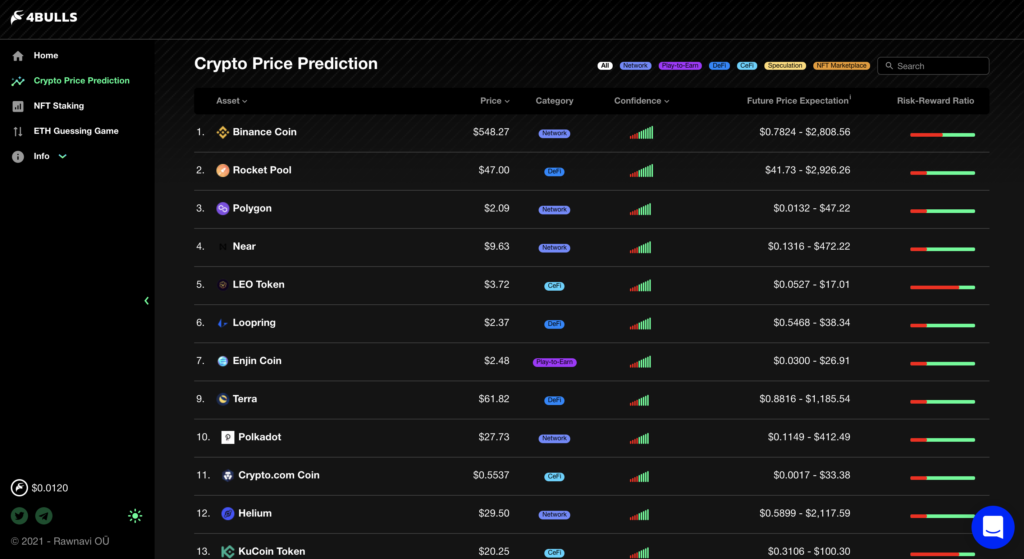
Upon launch, the 4Bulls Price Prediction Tool presents a comprehensive list of top cryptocurrencies. A table provides sortable columns for the asset including the current price, category, confidence, future price expectation, and a risk-to-reward ratio.
The list is initially sorted by “confidence” rating — highest to lowest — represented by a score (from 0 to 10). The higher the score, the lower the asset’s risk as determined by the tool’s algorithm.
Clicking on either the “asset” or “confidence” column heading will re-sort the list to display assets with the lowest confidence first. By confidence, we assume they mean the algorithm’s level of confidence in its own price predictions.
The list can also be sorted by current price — low to high, or high to low.
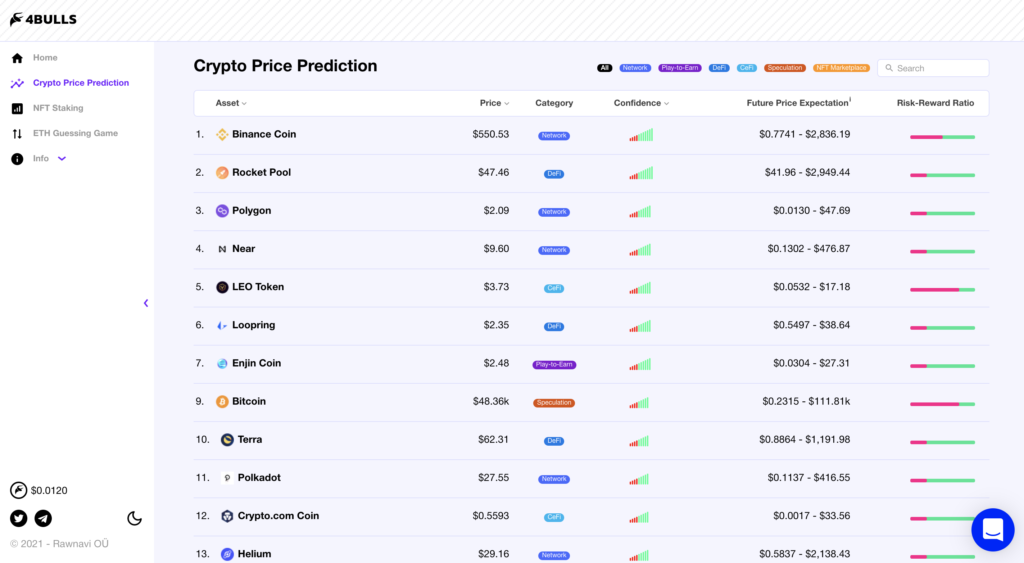
At the time of writing, Binance Coin and Rocket Pool are listed to have the highest confidence ratings, followed by Polygon, Near Protocol, LEO Token, Loopring, Enjin, and Terra. And Crypto.com rounds out the top 10. Of course, these are expected to change as the market evolves.
By selecting one of the asset categories from the top menu, the user can display only coins and tokens in a particular asset category.
Categories on the Price Prediction Tool include:
- All
- Network
- Play-to-Earn
- DeFi
- CeFi
- Speculation
- NFT Marketplace
- Web3
Future Price Prediction displays a wide-ranging high and a low price. And the risk-to-reward ratio is displayed as a red and green progress bar-style icon — more red equals higher risk.
The Price Prediction charts
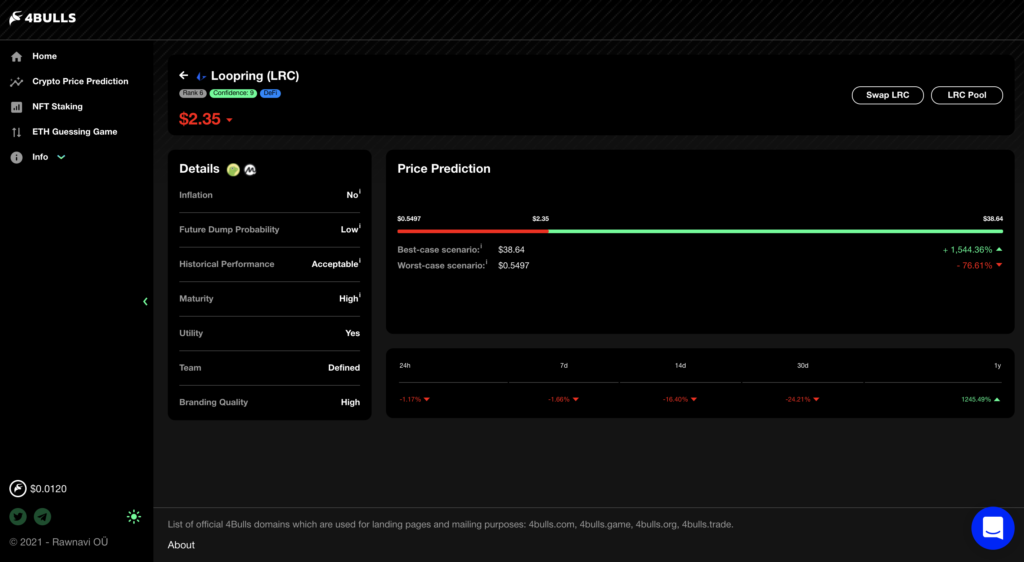
Clicking on any of the assets in the list sends the user to a nice clean table of Details. The table displays ratings related to that asset plus an easy to interpret Price Prediction chart.
Also included are icons for various crypto tracking websites such as CoinGecko and CoinMarketCap where users can dive deeper into the technicals of an asset such as price charts, performance, and other market statistics.
The Details table includes:
- Inflation (a function of the asset’s tokenomics)
- Future Dump Probability (low to high)
- Historical Performance (poor to impressive)
- Maturity (the age of the asset)
- Utility (yes or no)
- Team (anonymous or defined)
- Branding qualify (low, acceptable, high)
Some of these details include additional information upon rollover such as very brief explanations of tokenomics, historical performance, and maturity.
The all-important Price Prediction chart shows a red/green bar with worst-case and best-case price scenarios at each end with the current price somewhere in between. The area above and below the current price is coded in green and red respectively. If the red area is larger than the green area, then presumably the tool is implying that the price is more likely to drop than to rise over the coming year.
Pros and Cons of 4Bulls Price Prediction tool
It’s important to point out that the tool is only as accurate as its algorithm. If the algorithm is accurate then this tool could be highly valuable to crypto traders. However, the algorithm that determines these predictions is not specified on the tool. Our assumption is that the algorithm could be tweaked over time to produce better and better results. If the tool is accurate, it could be quite valuable.
Without commenting on the accuracy of the tool, here are some pros and cons that we noticed:
Pros
- This tool is very clean and easy on the eyes. Information is easy to find.
- The list of coins and tokens is comprehensive and includes all of the top assets in the market.
- Users can choose between dark and light display modes. Thanks for that.
- A search bar allows users to quickly search for a particular asset.
- The highest- and lowest-risk assets can quickly be identified at a glance.
Cons
- There’s no indication of the algorithms used to determine the price predictions, risks, and confidence levels.
- The columns are not sortable by risk/reward ratio, a rating of high importance in the usefulness of the tool.
- The daily, weekly, monthly, and yearly price predictions are given in percent of change only and not an actual price prediction. It would be nice to see both at a glance.
Overall Impression
Overall, this looks like a very promising application and another useful apparatus in the crypto investors’ tool kit. The clean, easy-to-use interface will appeal to users of all levels.
The usefulness of the tool all comes down to the accuracy of the underlying algorithms. If the tool can help crypto investors weed out high risk/low reward coins and tokens, and highlight the lower risk/higher reward assets then it could save investors quite a bit of DYR time while maximizing profits and minimizing losses.


